728x90
시각화 matplotlib] "hist, boxplot, plot 그리기", kind='bar', legend(loc='center'), ylabel, grid
데이터프레임.plt( kind = 'bar' ) 이용
# 모델별 결과 시각화
# pandas의 plot 함수을 사용하여 AI모델 별 accuracy_score, f1_score 수직 그래프 시각화 합니다.
# grid를 추가해 주세요.
# legend를 표시하고, 위치는 center 입니다.
import matplotlib.pyplot as plt
result_comp.plot(kind= 'bar')
plt.legend(loc= 'center'  )
plt.grid()
plt.show()

| 시각화 matplotlib | |
 |
* 히스토그램 작성 plt.hist(데이터프레임.컬럼명, bins = 숫자, edgecolor = '색상명') plt.title('제목') plt.ylabel('y 라벨명') plt.show() |
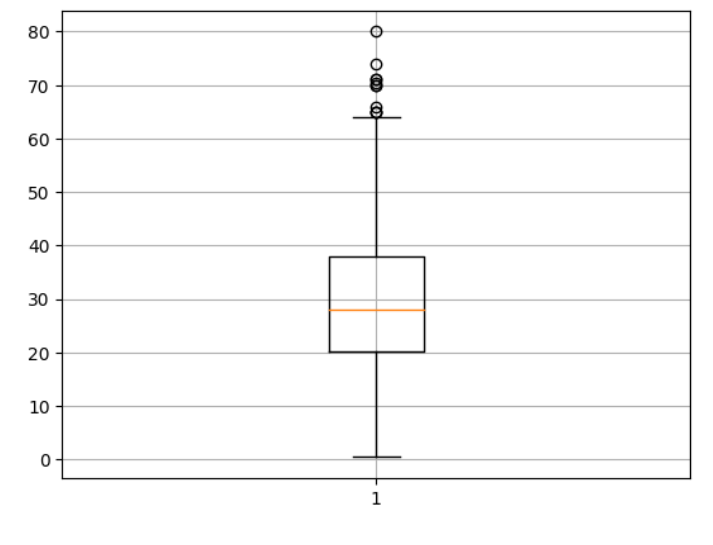 |
Boxplot 그리기 plot.boxplot(데이터프레임['컬럼명']) 옆으로 그리려면, plt.boxplot(데이터프레임['컬럼명'], vert=False) plt.grid() plt.show() |
 |
plot 차트 이용 plt.plot(데이터프레임['컬럼명']) |
 |
plot 차트 점 찍기 plt.figure( figsize= (20,3)) plt.plot(acc['accuracy_score'], marker ='.' ) plt.xlabel('train_features') plt.ylabel('accuracy') plt.grid() plt.show() |
728x90
'데이터 - 시각화' 카테고리의 다른 글
| 시각화 matplotlib] 한글 입력, 경고문구 무시, 경로, 목록_rc, rcParams, os, getcwd(), lisdir() (0) | 2023.11.14 |
|---|---|
| 데이터 시각화 다변량] crosstab (0) | 2023.09.27 |
| 데이터 시각화 이변량] "scatterplot, pairplot, jointplot, regplot 그리기" (0) | 2023.09.05 |
| 데이터 시각화 단변량] "countplot, pie chart 그리기", grid, value_counts(), (0) | 2023.09.05 |
| 데이터 시각화 단변량] "kdeplot, histplot, plot 그리기", sns.kedplot, sns.histplot, kde, legend, title, mean (0) | 2023.09.05 |